Shiny New Server

I got my hands on a nice new server (20x 3GBZ ivy Bridge v2 cores) and managed to connect to some nice Violin Memory Flash capacity.

With nearly no tuning I kicked off some workload and was  quite pleased with the results.

Some of the best vdbench results I have seen for FC connected persistent storage, from a single dual socket server, or from a 6.x linux.

[root@dell-oel6 ~]# uname -a
Linux dell-oel6 3.8.13-16.2.1.el6uek.x86_64 #1 SMP Thu Nov 7 17:01:44 PST 2013 x86_64 x86_64 x86_64 GNU/Linux

[root@dell-oel6 ~]# vi tom.config

100% Reads 

[root@dell-oel6 ~]# ./vdbench -f tom.config

11:23:13.740 input argument scanned: ‘-ftom.config’

11:23:14.163 All slaves are now connected
11:23:15.002 Starting RD=run3; I/O rate: Uncontrolled MAX; elapsed=60; For loops: threads=32.0

Oct 17, 2014 interval i/o MB/sec bytes read resp resp resp cpu% cpu%
rate 1024**2 i/o pct time max stddev sys+usr sys
11:23:25.129 1 1020533.40 3986.46 4096 70.01 0.901 1765.584 3.901 49.1 41.9
11:23:35.080 2 1034747.00 4041.98 4096 70.00 0.896 1898.664 4.106 49.6 45.4
11:23:45.109 3 1035505.40 4044.94 4096 70.00 0.895 2030.101 4.073 49.9 45.7
11:23:55.104 4 1036199.80 4047.66 4096 70.00 0.894 1828.606 4.124 49.5 45.4
11:24:05.102 5 1035522.00 4045.01 4096 69.99 0.895 2310.299 4.058 49.4 45.3
11:24:15.099 6 1036075.00 4047.17 4096 69.99 0.894 2030.939 4.003 49.3 45.2
11:24:15.108 avg_2-6 1035609.84 IOPS 4045.35 MB/sec 4096 70.00 0.895 2310.299 4.073 49.6 45.4
11:24:19.157 Vdbench execution completed successfully. Output directory: /root/output

50/50 r/w 64k IO

[root@dell-oel6 ~]# ./vdbench -f tom.config

11:35:06.298 input argument scanned: ‘-ftom.config’

11:35:06.716 All slaves are now connected
11:35:08.001 Starting RD=run3; I/O rate: Uncontrolled MAX; elapsed=60; For loops: threads=17.0

Oct 17, 2014 interval i/o MB/sec bytes read resp resp resp cpu% cpu%
rate 1024**2 i/o pct time max stddev sys+usr sys
11:35:18.055 1 112100.90 7006.31 65536 49.98 4.359 1322.165 9.009 7.3 3.7
11:35:28.066 2 113141.60 7071.35 65536 50.07 4.372 2020.149 8.952 4.5 3.9
11:35:38.063 3 112481.10 7030.07 65536 50.01 4.380 1336.651 8.843 4.4 3.9
11:35:48.058 4 112552.10 7034.51 65536 49.98 4.381 1819.720 9.119 4.4 3.9
11:35:58.058 5 112498.50 7031.16 65536 49.92 4.380 1706.458 8.902 4.4 3.9
11:36:08.058 6 112585.90 7036.62 65536 50.00 4.379 1386.934 9.135 4.2 3.8
11:36:08.066 avg_2-6 112651.84 IOPS 7040.74  MB/s 65536 50.00 4.378 2020.149 8.991 4.4 3.9
11:36:10.710 Vdbench execution completed successfully. Output directory: /root/output

100% writes

[root@dell-oel6 ~]# ./vdbench -f tom.config

11:40:42.487 All slaves are now connected
11:40:44.001 Starting RD=run3; I/O rate: Uncontrolled MAX; elapsed=60; For loops: threads=37.0

Oct 17, 2014 interval i/o MB/sec bytes read resp resp resp cpu% cpu%
rate 1024**2 i/o pct time max stddev sys+usr sys
11:40:54.144 1 983854.00 3843.18 4096 0.00 1.075 1276.008 4.268 45.9 38.5
11:41:04.111 2 998762.80 3901.42 4096 0.00 1.075 1276.465 4.137 47.6 43.5
11:41:14.107 3 996183.40 3891.34 4096 0.00 1.076 1265.410 4.287 47.4 43.3
11:41:24.072 4 996273.50 3891.69 4096 0.00 1.076 1290.658 4.218 47.1 43.1
11:41:34.071 5 995814.10 3889.90 4096 0.00 1.076 1319.793 4.148 46.7 42.8
11:41:44.066 6 993638.60 3881.40 4096 0.00 1.079 1236.961 4.188 47.1 43.1
11:41:44.074 avg_2-6 996134.48 IOPS 3891.15 MB per sec 4096 0.00 1.076 1319.793 4.196 47.2 43.1
11:41:47.986 Vdbench execution completed successfully. Output directory: /root/output

Flash Marketing Performance: Vanity Vs Reality

The best thing about flash memory is that it has no moving parts. Data is stored as independent bits of data, which are unrelated to each other. The size of application IO is immaterial, it will simply translate into multiple read or writes at the flash layer.

The total available performance is really limited by the time it takes to read or write to a page and the number of pages available to read and write from. It should be possible to Read or Write to the system at a set rate of bandwidth regardless of the size of the application IO, assuming multiple parallel processes are in operation – I don’t just have a single threaded workload.

This has a fantastic performance advantage, compared to disk, in that it does not matter if data is accessed randomly or sequentially with large IO’s or small.

What this means

One thing I really like about the Violin systems is the ability to drive consistent bandwidth regardless of IO size. This means that the workloads that drive small transfers of a random nature are less likely to cause noticeable impact to other workloads on the same storage, and makes our arrays ideally suited to mixed workloads. This means many threads of work, each potentially doing a different or varying average IO size.

Screen Shot 2014-07-15 at 2.13.28 PM

Whats Funny    

I have recently seen a number of vendor marketing claims that suggest you should not be interested in how many small transfers you can do, only the number of average sized IOs your system can do. This is funny because disk arrays are good at doing average size IOs. So if the software on top of a flash array does not let you drive full bandwidth at a small IO size, then you are missing the point of flash.

But some vendors seem to quote only one optimal block size, claiming that this is optimal for a certain type of application – 32K is often chosen as an average IO size. This is ok, and relevant for some applications, but certainly not all. Also being an average it will probably be an average of some large IOs and many small IOs.

You need to ensure there is no bottleneck in the hardware or software that stops you going above a limited rate of IOPS regardless of block size.

Screen Shot 2014-07-15 at 2.13.41 PM

So what to look for

You need to look for a flash array where the number of IOPS it can sustain nearly doubles as the IO size halves. Or delivers the same high rates of bandwidth regardless of IO size.

Flash is being used to replace disks, but the marketing message can often obscure the deeper benefits that flash offers. All IOPs are not equal – they just should be!

* Please note that both graphs deliberately have no scale, and should be viewed as purely hypothetical and make no claims.

What is SMB3 with RDMA / SMB Direct

Following the full release of Violin’s WFA product, I can now share some of my understanding gained from using it over the last six months or so. Violin’s WFA – “Windows Flash Array”-  is a storage system that embeds a specially optimised version of Windows 2012 R2 on our gateway modules and provides very fast performance to SQL, Hyper-V and other application environments over SMB3. For more details see HERE, or for Microsofts view you can review the TechNet blog here.

This is the first of a number of blog entries to provide some further technical detail on the product and the benefits it provides.


Screen Shot 2014-04-22 at 11.14.22 AM

While it is essentially a simple premise and a product that is very easy to use and manage, it has taken me a while to get my head around the new vocabulary associated with using the latest version of SMB3. SMB Direct, iWARP, RoCE, SMB-Multichannel  are all technologies and acronyms that combine to deliver the biggest benefits to SMB3 over previous versions of the protocol. What are those benefits I hear you ask? In short they fall into two areas: performance and availability.

cheeter

Performance: with the improvements in the protocol, we can now drive very high bandwidth and very low latency from a modest Windows server only using a small amount of CPU resource. I have done my own testing and can confirm that the latencies are significantly lower then FC to the same array for nearly every IO profile…. For full details of the performance numbers please contact your Violin representative.

Why is it faster? The simple answer is RDMA. Microsoft have added the capability to perform data transfers via “Remote Direct Memory Access” to SMB3 and named it SMB Direct. In my simple understanding, RDMA allows one system to perform a data copy by directly reading or writing from the memory of another computer, avoiding many levels of protocol overhead. There are two competing implementations that are both supported by SMB Direct; iWARP and RoCE and interfaces either support one or the other.

The other nice thing about SMB-Direct is that it requires no setup, if the environment supports SMB-Direct it just works. The easiest way to tell if it’s working is by looking at the SMB-Direct counters in perfmon, or using the powershell “commandlet” Get-SmbMultichannelConnection.

Screen Shot 2014-04-22 at 11.10.48 AM


Availability: Microsoft have added a new capability in to the SMB protocol called SMB-Multichannel. This automatically detects and utilises all available paths to an SMB share that are running at the fastest speed. It is like MPIO or Ethernet link bonding, but requires no manual setup or additional software and provides very fast failover and failback. Failover between cluster nodes on the Violin WFA are pretty much undetectable to a client server; even when physically pulling a network link on a client under very heavy load IO continues with little interruption. The below example is created by saturating 4 links on a client before pulling one link, then reinserting it 30 seconds later.

linkremoval and re-add

Historically I have been reluctant to recommend file based shared storage solutions for applications or databases that require the lowest latency and the highest reliability. However, with SMB3 and SMBDirect we get higher bandwidth and lower latency storage connectivity with automatic resiliency. When combined with the Violin 6000 array as WFA you get a very high performance solution that is very easy to manage.

Look out for the next blog to provide comparisons with FC & SMB3 traffic and also SMB3 with and without RDMA…

Yum update Oracle linux 6u2 to 6u5 causes direct connect lun visibility issues BFA HBAs

One of my esteemed Oracle colleagues recently discovered a problem accessing his data after upgrading a system with Yum to 6u5. He was upgrading to get the newer UEK kernel but he also ended up with a newer Brocade HBA driver.

 Brocade FC/FCOE Adapter, hwpath: 0000:8b:00.1 driver: 3.0.2.2   <- before upgrade

 Brocade FC/FCOE Adapter, hwpath: 0000:8b:00.1 driver: 3.1.2.1  <- after upgrade

It took a while to spot the problem because there are no obvious errors but it seems that the default behavior of the Brocade HBAs had changed. I think this is specific to “direct connect” storage connections (ones with no switch between server and storage ports).

On the older version all was working well with the storage FC ports set to “Point to Point” only and the adapters set as default (also point to point).

After switching the upgrade to get a functional environment we had to switch the storage array ports to “Loop preferred” the host and storage then successfully negotiated a “Point to Point”  communication.

The only indication of the problem was the below entrys from the messages file.

Apr 22 16:52:31 kernel: bfa 0000:86:00.0: Remote port (WWN = 21:00:00:24:ff:34:6c:ba) connectivity lost for logical port (WWN = 10:00:00:05:1e:59:f3:9e)

Apr 22 16:52:31 kernel: bfa 0000:86:00.0: Target (WWN = 21:00:00:24:ff:34:6c:ba) connectivity lost for initiator (WWN = 10:00:00:05:1e:59:f3:9e)


Do I still need to tune storage in Linux?

Here at Violin we have a number of best practice recommendations for all types of OS and databases. Some customers follow all of them, whilst others require persuading.

One recommendation that can sometimes cause debate is utilizing the UDEV rules to optimize the IO schedulers in Linux. Sometimes this can make a dramatic difference, other times very little.

A colleague of mine has recently been investigating slightly unpredictable performance on a VM running RHEL compared to SLES. It turns out that the UDEV recommendations had not been applied to either. It seems that the defaults in SLES 11 are better optimized by default for high performance in Virtual Machines.


RHEL_Orion_single_vCPU

SLES_Orion_Single_vCPU


Both VMs in the above example are deliberately limited to a single vCPU and hit limits of guest CPU before stretching the storage.
But in this situation we saw up to a 15% improvement on SLES and 30% improvement on RHEL.
So different flavours have different benefits, but even at these modest rates of performance there is a significant benefit in both bandwidth and latency.

To get the recommended best practices for your environment just ask your Violin contact.


Lies, damn lies, and storage performance

I often get involved in sizing Violin arrays for particular requirements.Screen Shot 2014-03-26 at 1.52.17 PM
We get requirements that are written in many different ways, some make sense and others don’t.

It probably does not help that a lot of arrays are marketed against levels of IOPS,

“1 Million IOPS” is maybe the most frustrating request I hear.

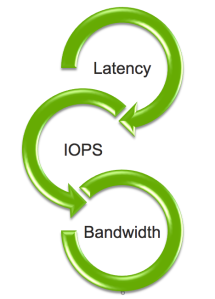
We have the three traditional metrics, IOPS, bandwidth and Latency.

They are all closely related. Bandwidth really is just a measure of how many IOPS and at what IO size. IOPS are limited by how many operations your application submits in parallel and how long it takes your storage to respond. Latency is a measure of how long it takes. FlashDBA has put his every thought on these metrics here.

So the most interesting number to look at is latency, but when to measure the latency?

latency vs IOPS

If you consider the above graph, the two systems being measured have similar minimum latency and both scale to good rates of IOPS. However, the area in the middle will result in very different application performance between the two systems! It can result in a factor of ten in application performance.

As these differences between different systems are now better known, we are getting less requests for minimum latency numbers and maximum IOPS rates. We are increasingly being asked excellent questions like what latency will we see if I do this many iops?

To answer this question sensibly  for  flash arrays, unfortunately you have to ask more questions. You need to know;

  • What size are these IOs on average? On flash a single 16k write takes as much backend work as four 4k writes.
  • Are the IOs random or sequential? Random operations work better on some systems than others.
  • How much capacity will these IOs be spread over? That is the active working set size, not just the total usable capacity required.
  • What is the read / write mix of the IOs? Flash can perform very differently for a 90% write workload compared to a 10% write workload.
  • How many hours a day does this rate of IOPS and bandwidth need to be sustained? Background operations can kick in after several hours of operation.
  • What protocol will be used to connect the server (s) to the storage? They have different limits and different latencies.
  • Is de-duplication planned to be switched on?

Arrays that have de-duplication turned on by default, also add complexity to the specification. If you are asking one of these vendors on IOPS levels at a certain latency level, you need to caveat that with:

How cryptographically unique is the working data set?

Why do you ask this? Because if a test harness constantly sends similar data content as read and write requests to an array, the data will be permanently embedded in DRAM cache, in fact no IO request will ever reach flash. This gives an artificially high IOPS and artificially low latency measurement, that will never be achieved with real data.

We are finding that customers ask a selection of vendors questions like, how many random 8k IOPS can I achieve at less than 0.5ms response time 50/50 read/write spread over 10TB of usable capacity? Often we find we are the only vendor able to provide accurate results to such requests.

So what is the best way to confirm a system is fit for your requirement?

Try and understand what your systems need. What performance are they currently driving and what are they capable of driving? At Violin we have some excellent tools for looking at SQL or Oracle stats and providing you a report about the benefit of using flash. Feel free to take advantage of them…

Be wary of IOMeter or FIO or VDbench type demonstrations, there are so many parameters, they can be adjusted to show nearly anything and are probably not relevant to you.

I would look for results of running your database or application with your dataset size or bigger for days or weeks on end. Some published results like VMMark or Oracle benchmarks are good for this.

Best still is to find a reference customer with a similar environment to yours. Ask that existing customer what happens to performance when a module breaks…….but that’s a subject for another blog entry.

SLES 11 SP3 error from multipath rport-6:0-0: failed to set fast_io_fail_tmo to 5, error 22

SLES 11 SP has quite a few differences from other flavours and from earlier versions of SLES in the format of it multipth.conf configuration. When testing in the lab i hit a new error which stumped me for a while,

When scanning for multipath devices I was getting the below entry.

rport-6:0-0: failed to set fast_io_fail_tmo to 5, error 22

I found that i could get rid of this error by setting both fast_io_fail_tmo and  dev_loss_tmo explicitly in a custom multipath.conf entry. This appeared to work, but should not be required as the SLES defaults are fine.

However a quick gateway failover test showed that setting these parameters had had a very bad effect on path failback time. Increasing failover from subsecond to multiple minutes.

After some scratching of heads the solution was obscure but simple. I had rr_min_io set as this had provids a significant performance boost on other versions of linux. This parameter is deprecated as of SLES 11sp2. With this parameter and the tmo parameters removed from the configuration path and controller failover again works perfectly.

So the sles 11 SP3 version of the multipath.conf devices entry looks like this for Violin.

devices {
device {
vendor                  “VIOLIN”
product                 “SAN ARRAY”
path_grouping_policy    group_by_serial
path_selector           “round-robin 0”
path_checker            tur
hardware_handler        “0”
failback                immediate
rr_weight               uniform
no_path_retry           fail
}
device {
vendor                  “VIOLIN”
product                 “SAN ARRAY ALUA”
path_selector           “round-robin 0”
prio                    “alua”
path_grouping_policy    group_by_prio
path_checker            tur
hardware_handler        “0”
failback                immediate
no_path_retry           fail
detect_prio             yes

Testing XFS filesystem performance with FIO.

I have been pretty surprised by the level of performance possible from XFS on a single partition. I managed to see 1.16 million IOPS as per below. Pretty good..


Iostat output

Device:         rrqm/s   wrqm/s     r/s     w/s    rMB/s    wMB/s avgrq-sz avgqu-sz   await  svctm  %util

vtmsa             0.00     0.00 1159659.60    0.00  4529.92     0.00     8.00   503.92    0.39   0.00 103.76


Device:         rrqm/s   wrqm/s     r/s     w/s    rMB/s    wMB/s avgrq-sz avgqu-sz   await  svctm  %util

vtmsa             0.00     0.00 1155659.80    0.00  4514.28     0.00     8.00   484.97    0.38   0.00 103.46


Device:         rrqm/s   wrqm/s     r/s     w/s    rMB/s    wMB/s avgrq-sz avgqu-sz   await  svctm  %util

vtmsa             0.00     0.00 1146859.20    0.00  4479.94     0.00     8.00   468.77    0.36   0.00 103.72


Fio updates

fio -name iops -rw=randread -runtime=500 -iodepth 1 -ioengine libaio -direct=1 -filename /mnt/tom/fio/test -bs=4k -size=1000000000001 -numjobs=500
iops: (g=0): rw=randread, bs=4K-4K/4K-4K/4K-4K, ioengine=libaio, iodepth=1

.

.

Jobs: 500 (f=345): [rrrrrrrrrrrrrrrrrrrrrrrrrrrrrrrrrrrrrrrrrrrrrrrrrrrrrrrrrrrrrrrrrrrrrrrrrrrrrrrrrrrrrrrrrrrrrrrrrrrrrrrrrrrrrrrrrrrrrrrrrrrrrrrrrrrrrrrrrrrrrrrrrrrrrrrrrrrrrrrrrrrrrrrrrrrrrrrrrrrrrrrrrrrrrrrrrrrrrrrrrrrrrrrrrrrrrrrrrrrrrrrrrrrrrrrrrrrrrrrrrrrrrrrrrrrrrrrrrrrrrrrrrrrrrrrrrrrrrrrrrrrrrrrrrrrrrrrrrrrrrrrrrrrrrrrrrrrrrrrrrrrrrrrrrrrrrrrrrrrrrrrrrrrrrrrrrrrrrrrrrrrrrrrrrrrrrrrrrrrrrrrrrrrrrrrrrrrrrrrrrrrrrrrrrrrrrrrrrrrrrrrrrrrrrrrrrrrrrrrrrrrrrrrrrrrrrrrrrrrrrrrrrrrrrrrrrrrrrrrrrrrrrrrrrrrrrrrrrrrr] [0.0% done] [4136MB/0KB/0KB /s] [1059K/0/0 iops] [eta 1158050437d:Jobs: 500 (f=369): [rrrrrrrrrrrrrrrrrrrrrrrrrrrrrrrrrrrrrrrrrrrrrrrrrrrrrrrrrrrrrrrrrrrrrrrrrrrrrrrrrrrrrrrrrrrrrrrrrrrrrrrrrrrrrrrrrrrrrrrrrrrrrrrrrrrrrrrrrrrrrrrrrrrrrrrrrrrrrrrrrrrrrrrrrrrrrrrrrrrrrrrrrrrrrrrrrrrrrrrrrrrrrrrrrrrrrrrrrrrrrrrrrrrrrrrrrrrrrrrrrrrrrrrrrrrrrrrrrrrrrrrrrrrrrrrrrrrrrrrrrrrrrrrrrrrrrrrrrrrrrrrrrrrrrrrrrrrrrrrrrrrrrrrrrrrrrrrrrrrrrrrrrrrrrrrrrrrrrrrrrrrrrrrrrrrrrrrrrrrrrrrrrrrrrrrrrrrrrrrrrrrrrrrrrrrrrrrrrrrrrrrrrrrrrrrrrrrrrrrrrrrrrrrrrrrrrrrrrrrrrrrrrrrrrrrrrrrrrrrrrrrrrrrrrrrrrrrrrrrr] [0.0% done] [4173MB/0KB/0KB /s] [1068K/0/0 iops] [eta 1158050437d:Jobs: 500 (f=375): [rrrrrrrrrrrrrrrrrrrrrrrrrrrrrrrrrrrrrrrrrrrrrrrrrrrrrrrrrrrrrrrrrrrrrrrrrrrrrrrrrrrrrrrrrrrrrrrrrrrrrrrrrrrrrrrrrrrrrrrrrrrrrrrrrrrrrrrrrrrrrrrrrrrrrrrrrrrrrrrrrrrrrrrrrrrrrrrrrrrrrrrrrrrrrrrrrrrrrrrrrrrrrrrrrrrrrrrrrrrrrrrrrrrrrrrrrrrrrrrrrrrrrrrrrrrrrrrrrrrrrrrrrrrrrrrrrrrrrrrrrrrrrrrrrrrrrrrrrrrrrrrrrrrrrrrrrrrrrrrrrrrrrrrrrrrrrrrrrrrrrrrrrrrrrrrrrrrrrrrrrrrrrrrrrrrrrrrrrrrrrrrrrrrrrrrrrrrrrrrrrrrrrrrrrrrrrrrrrrrrrrrrrrrrrrrrrrrrrrrrrrrrrrrrrrrrrrrrrrrrrrrrrrrrrrrrrrrrrrrrrrrrrrrrrrrrrrrrrrrr] [0.0% done] [4329MB/0KB/0KB /s] [1108K/0/0 iops] [eta 1158050437d:Jobs: 500 (f=387): [rrrrrrrrrrrrrrrrrrrrrrrrrrrrrrrrrrrrrrrrrrrrrrrrrrrrrrrrrrrrrrrrrrrrrrrrrrrrrrrrrrrrrrrrrrrrrrrrrrrrrrrrrrrrrrrrrrrrrrrrrrrrrrrrrrrrrrrrrrrrrrrrrrrrrrrrrrrrrrrrrrrrrrrrrrrrrrrrrrrrrrrrrrrrrrrrrrrrrrrrrrrrrrrrrrrrrrrrrrrrrrrrrrrrrrrrrrrrrrrrrrrrrrrrrrrrrrrrrrrrrrrrrrrrrrrrrrrrrrrrrrrrrrrrrrrrrrrrrrrrrrrrrrrrrrrrrrrrrrrrrrrrrrrrrrrrrrrrrrrrrrrrrrrrrrrrrrrrrrrrrrrrrrrrrrrrrrrrrrrrrrrrrrrrrrrrrrrrrrrrrrrrrrrrrrrrrrrrrrrrrrrrrrrrrrrrrrrrrrrrrrrrrrrrrrrrrrrrrrrrrrrrrrrrrrrrrrrrrrrrrrrrrrrrrrrrrrrrrrrr] [0.0% done] [4359MB/0KB/0KB /s] [1116K/0/0 iops] [eta 1158050437d:Jobs: 500 (f=391): [rrrrrrrrrrrrrrrrrrrrrrrrrrrrrrrrrrrrrrrrrrrrrrrrrrrrrrrrrrrrrrrrrrrrrrrrrrrrrrrrrrrrrrrrrrrrrrrrrrrrrrrrrrrrrrrrrrrrrrrrrrrrrrrrrrrrrrrrrrrrrrrrrrrrrrrrrrrrrrrrrrrrrrrrrrrrrrrrrrrrrrrrrrrrrrrrrrrrrrrrrrrrrrrrrrrrrrrrrrrrrrrrrrrrrrrrrrrrrrrrrrrrrrrrrrrrrrrrrrrrrrrrrrrrrrrrrrrrrrrrrrrrrrrrrrrrrrrrrrrrrrrrrrrrrrrrrrrrrrrrrrrrrrrrrrrrrrrrrrrrrrrrrrrrrrrrrrrrrrrrrrrrrrrrrrrrrrrrrrrrrrrrrrrrrrrrrrrrrrrrrrrrrrrrrrrrrrrrrrrrrrrrrrrrrrrrrrrrrrrrrrrrrrrrrrrrrrrrrrrrrrrrrrrrrrrrrrrrrrrrrrrrrrrrrrrrrrrrrrrr] [0.0% done] [4400MB/0KB/0KB /s] [1126K/0/0 iops] [eta 1158050437d:Jobs: 500 (f=391): [rrrrrrrrrrrrrrrrrrrrrrrrrrrrrrrrrrrrrrrrrrrrrrrrrrrrrrrrrrrrrrrrrrrrrrrrrrrrrrrrrrrrrrrrrrrrrrrrrrrrrrrrrrrrrrrrrrrrrrrrrrrrrrrrrrrrrrrrrrrrrrrrrrrrrrrrrrrrrrrrrrrrrrrrrrrrrrrrrrrrrrrrrrrrrrrrrrrrrrrrrrrrrrrrrrrrrrrrrrrrrrrrrrrrrrrrrrrrrrrrrrrrrrrrrrrrrrrrrrrrrrrrrrrrrrrrrrrrrrrrrrrrrrrrrrrrrrrrrrrrrrrrrrrrrrrrrrrrrrrrrrrrrrrrrrrrrrrrrrrrrrrrrrrrrrrrrrrrrrrrrrrrrrrrrrrrrrrrrrrrrrrrrrrrrrrrrrrrrrrrrrrrrrrrrrrrrrrrrrrrrrrrrrrrrrrrrrrrrrrrrrrrrrrrrrrrrrrrrrrrrrrrrrrrrrrrrrrrrrrrrrrrrrrrrrrrrrrrrrrr] [0.0% done] [4420MB/0KB/0KB /s] [1131K/0/0 iops]

Here is what it looked like from the array UI.

Image

Hyper-V high speed options, VHDX, Pass Through or NPIV.

More and more we are seeing deployments of virtual environments with a wide range of hypervisors.
This year I have been involved with driving high rates of storage performance from OVM, KVM, SUSE XEN, Citrix XEN, Hyper-V and ESX.
The different versions have differing levels of information available about how to get maximum storage performance for the applications running in the VM.

There are some good documents that discuss the options available in Hyper-V and share the results of performance tests when using the different options. However they are run using disk based storage arrays which limit the results to around 10,000 IOPS per LUN.

Following a recent joint POC with Microsoft accelerating SQL databases we had an opportunity to get some new results using a Violin 6616 array a high powered 2012 server environment. Brocade also kindly loaned a low Latency switch to facilitate the connectivity.

We decided to run a number of tests to see how the options compared at a given rate of parallelism. Test not to find maximums but to contrast the relative performance.
As a base line we achieved a sustained 775k IOPS, 4.5 Gbytes per second and latency as low as 100 microseconds from a single hypervisor.

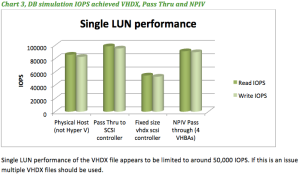
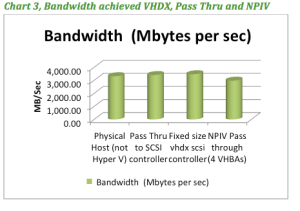
One of the more interesting things we compared was the methods of presenting the capacity. The below graphs may help you choose between the options.

To make it clear the below results are all on the same very fast Violin lun presented to the same Hypervisor, through the same Fibre optics, with the same load applied.

Screen Shot 2013-06-28 at 2.03.13 PM

Screen Shot 2013-06-28 at 2.05.04 PM


Screen Shot 2013-06-28 at 2.06.51 PM

For full results and recommendations please ask your violin contact for the white paper.